
APX Breakout Detection
$49.99
Note: After purchasing, the download link will be available for 30 days. You will receive an email with a download link, installation and setup guide.
Emails with License Keys and setups are sent Monday - Friday 8AM - 6PM CET Time. It may take a bit of time after your purchase to arrive into your inbox.
Anticipate Breakouts with APXLab Breakout Detection
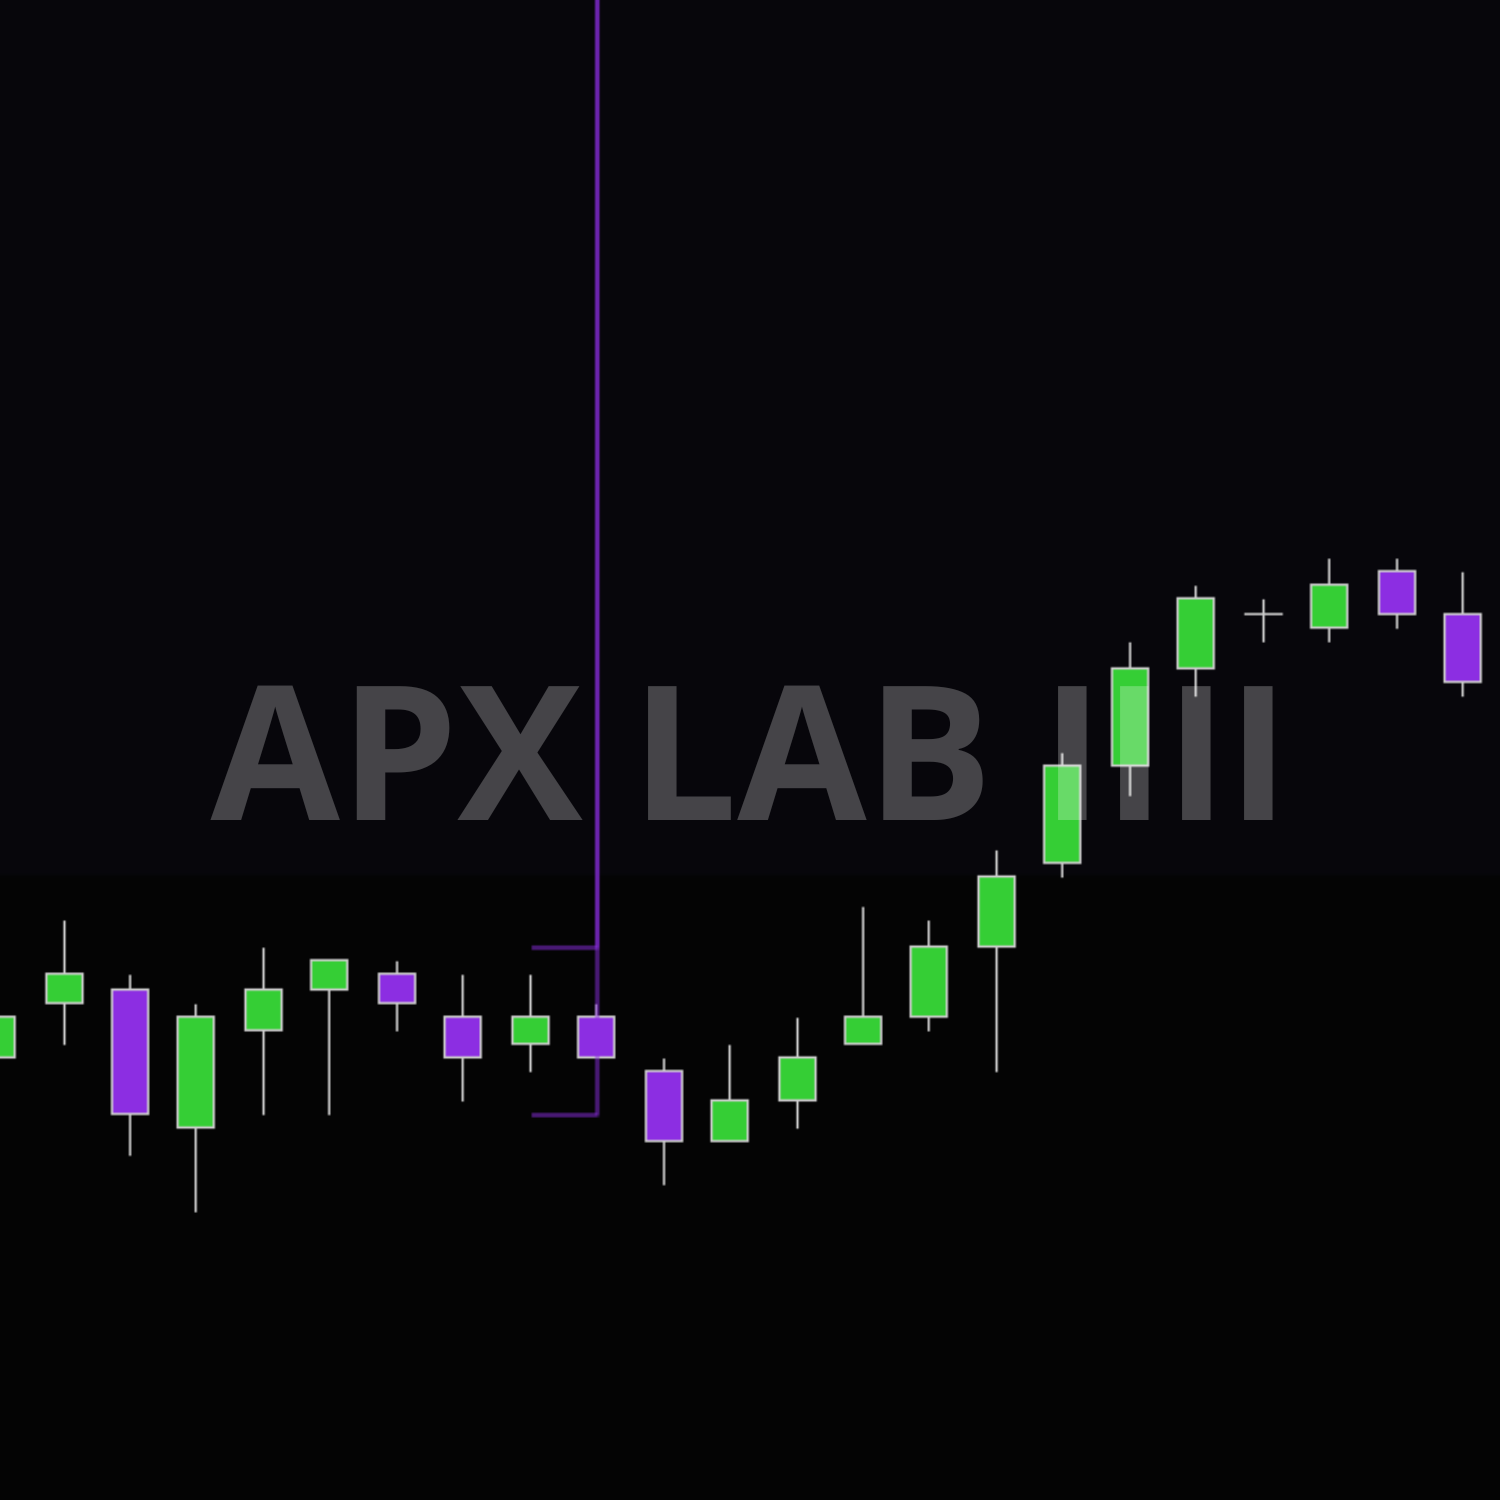
The APXLab Breakout Detection indicator identifies consolidation patterns and predicts impending breakouts using advanced volatility analysis. By combining ATR, ADX, and standard deviation metrics, this tool dynamically plots consolidation boundaries and alerts traders when price is poised for a directional move—helping you capitalize on emerging trends early.
Key Features:
Smart Consolidation Detection: Automatically identifies tight trading ranges using ATR/ADX based volatility thresholds.
Multi-Factor Confirmation: Combines ATR, ADX, and standard deviation to filter false breakout signals.
Customizable Sensitivity: Adjust the ATR period and volatility multipliers to match your trading style.
Real-Time Updates: Recalculates on every tick for precision in fast-moving markets.
Visual Alerts: Plots a vertical line when a potential breakout is calculated.
How It Works:
Volatility Analysis: Uses a user-defined ATR period to measure recent market volatility.
Range Detection: Identifies consolidation.
Dynamic Plotting: Continuously updates consolidation boundaries as new price action develops.
Breakout Signal: Plots lines when conditions no longer meet consolidation criteria, signaling a potential breakout.
Ideal For:
Swing traders seeking early entries into emerging trends
Day traders looking to capitalize on range breakouts
Volatility-focused traders monitoring contraction/expansion cycles
NinjaTrader 8 users needing automated consolidation detection
Advantages:
Provides objective criteria for identifying high-probability breakout setups
Reduces emotional bias by quantifying consolidation phases
Works across all timeframes and liquid instruments
Easy-to-interpret visual output integrates seamlessly with price charts
Limitations:
Best results require tuning ATR period to match instrument volatility
May lag during rapid market regime changes
Should be combined with volume/price action confirmation for optimal results
This is the only APX Lab "Lagging indicator", should be used with care.